Citizens harness the power of data in a blacked-out Buenos Aires

BUENOS AIRES -- In the Argentine capital, heat waves and power blackouts go together like grilled beef and chimichurri. Only the most savage hot spells, accompanied by the most prolonged energy crises, make the headlines.
The heat wave that struck Buenos Aires from December 13-31 last year was the only story in town. With daytime temperatures rarely dipping below 100 degrees Fahrenheit, households and businesses ramped up the air con -- and left it running. Their infrastructure frazzled by this unprecedented demand, the two energy utilities, Edenor and Edesur, were forced into a policy of ad hoc blackouts. Unprogrammed, or at least unpublicized, the cuts also seemed capricious to users who were given no idea where, when or for how long the blow might fall.
“The uncertainty and lack of information were almost as depressing as the blackouts,” says Celeste Acosta, a 24-year-old freelance creative and one of an estimated 800,000 citizens affected by the crisis. But this information gap also got her thinking.... What if enough ordinary citizens could be persuaded to enter their “power status” on a website? This data could then be used to color code a map of the city, with blocks and neighborhoods shaded according to the severity and duration of blackouts.
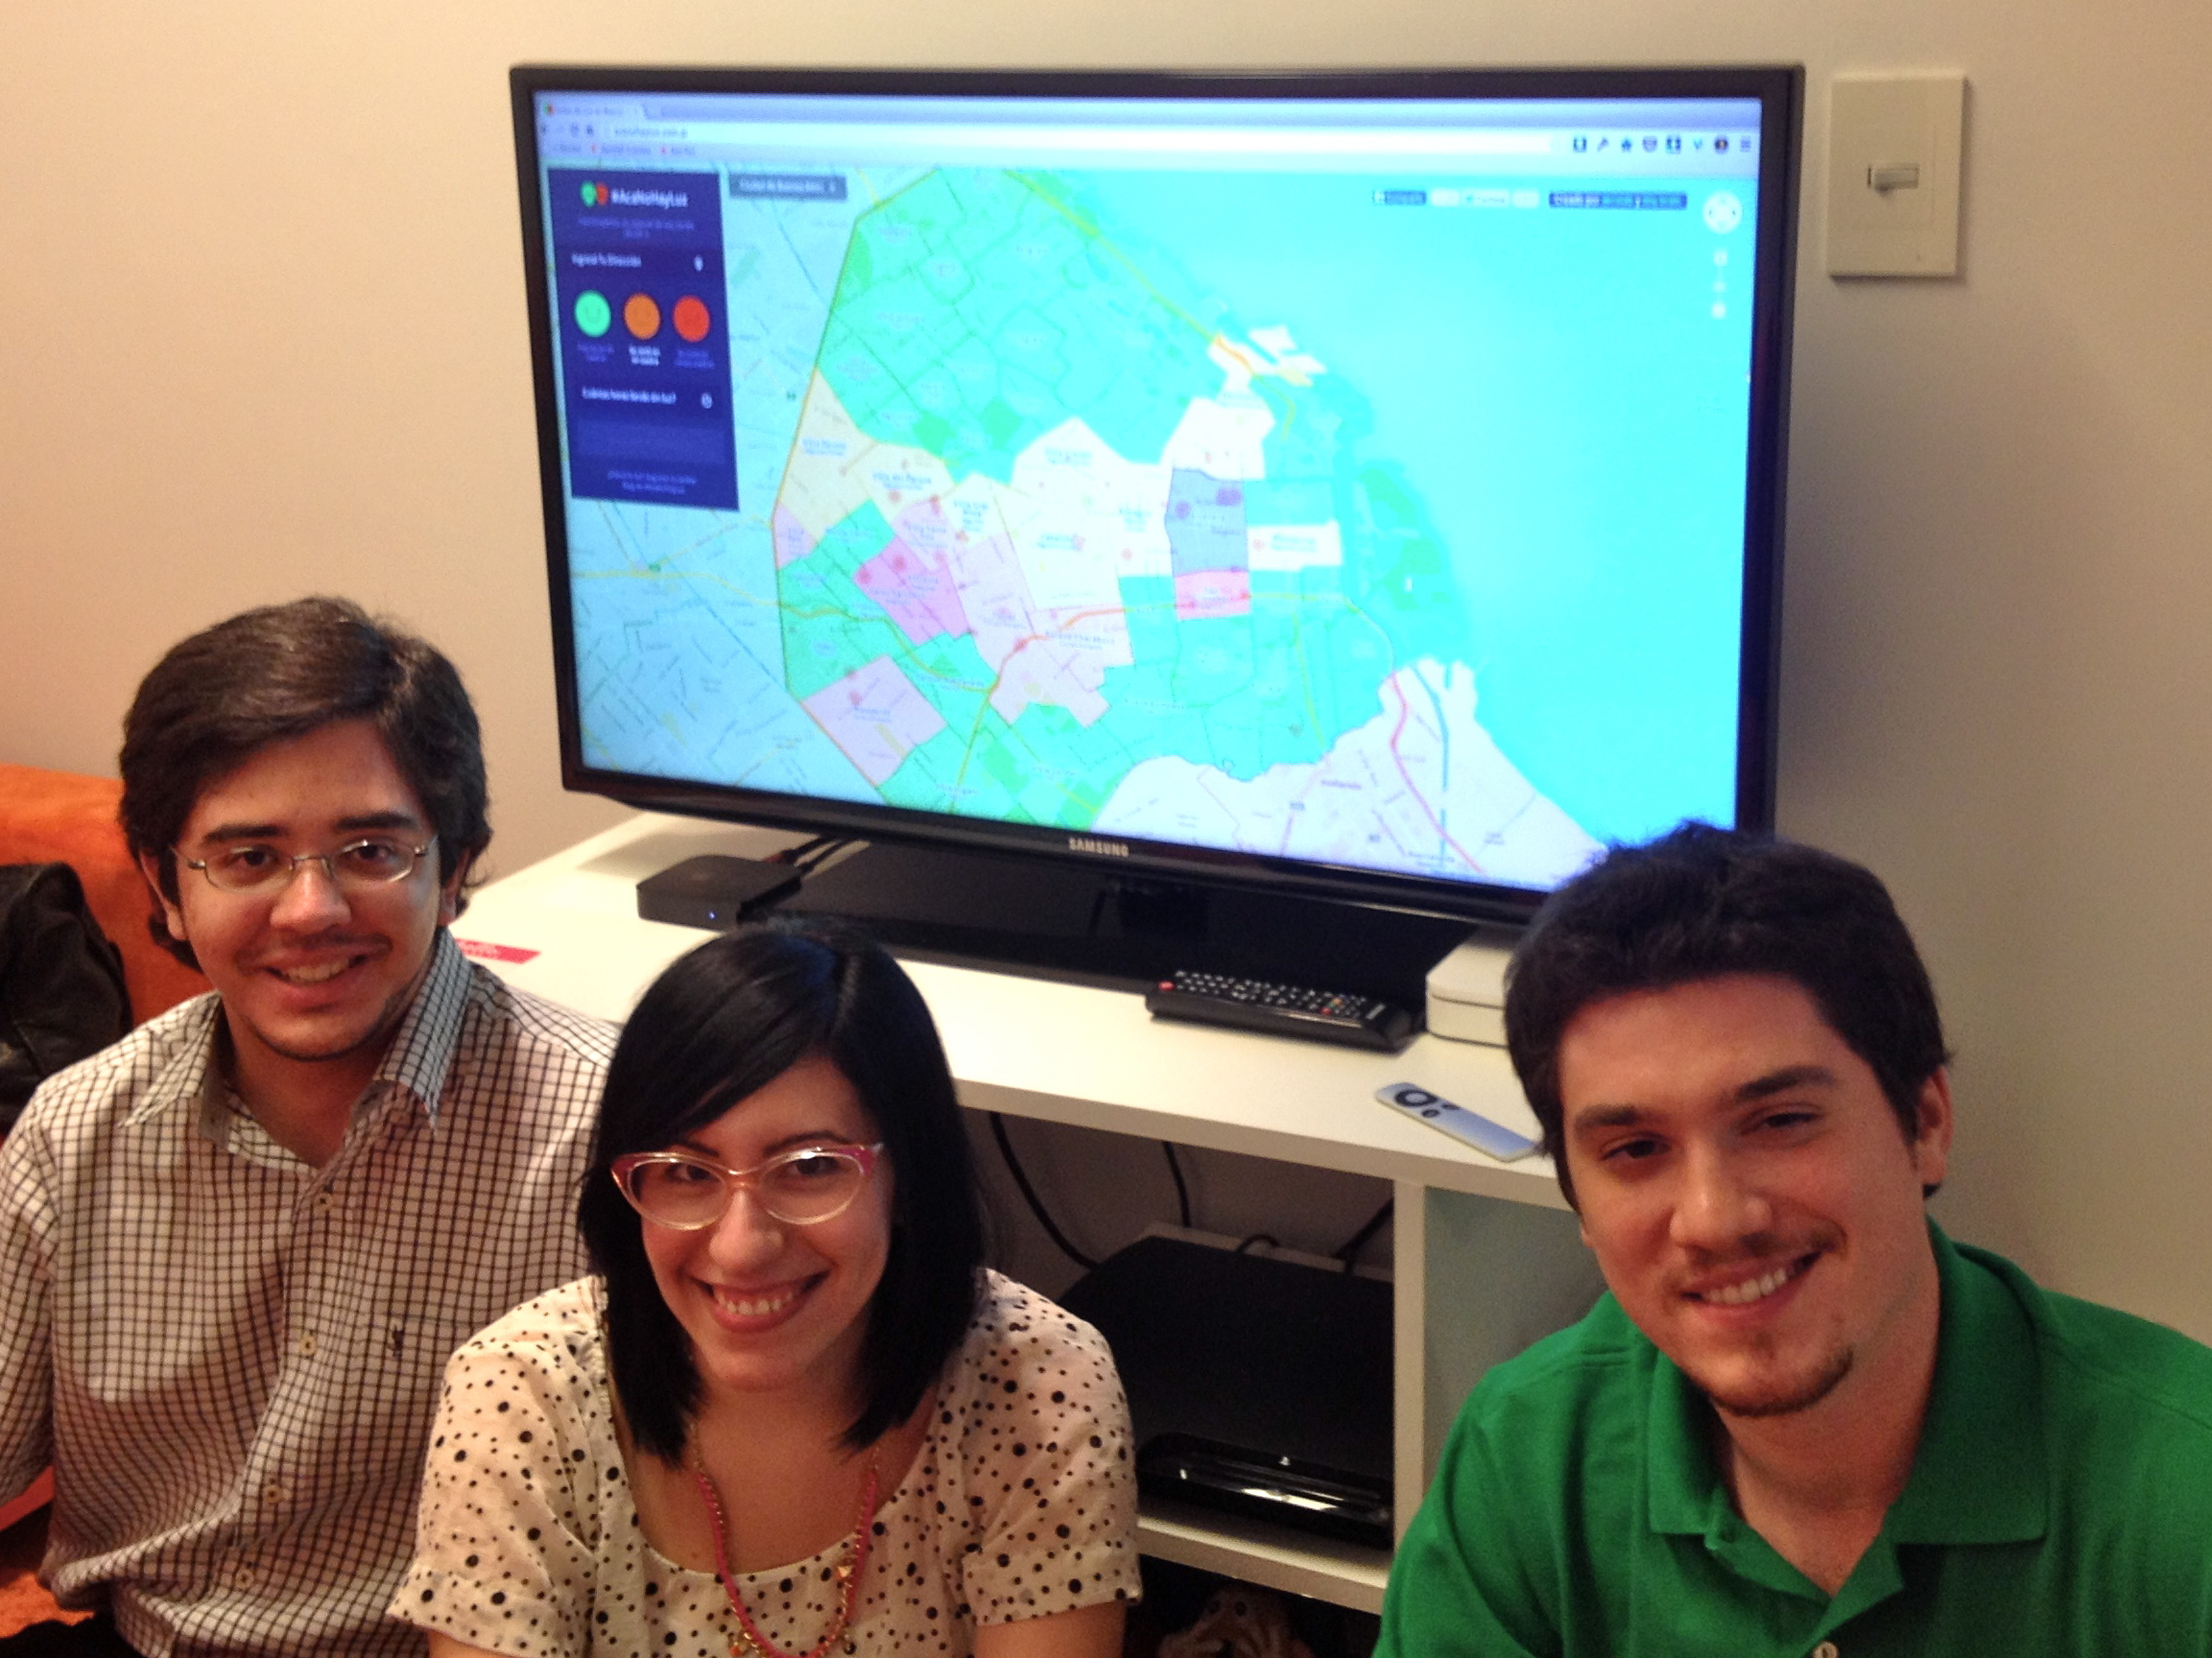
To help build the site, which she named acanohayluz.com (literally, “there’s no power here”), Acosta roped in her friends Agustín Linenberg and Roberto González of digital agency Aerolab. “We started on December 20, worked fast and launched Christmas Eve,” Linenberg says. “By then some people had been without power for a week, and street protests were cropping up everywhere. We hit Facebook and Twitter hard, and within a couple of days had logged 100,000 unique visitors.”
With their stripped-down site, social networking chops and not-for-profit ethos, Acosta and co. encapsulate an idealistic trend in web development, in which open-source tools and data are used to create citizen-driven services in the teeth of a crisis. After 2012’s Hurricane Sandy, for example, several New York agencies quickly built apps to spread real-time information and connect volunteers with agencies.
When citizens build services like these to fill a gap left by a bureaucracy, there’s a temptation to see this as the bureaucracy's failure rather than the citizen’s triumph. Many users of AcáNoHayLuz wondered aloud why the Buenos Aires city government hadn’t created a similar application. But in a subterranean way, it had. Several core elements of the site -- including precise neighborhood boundaries and the locations of electricity substations -- were drawn from the city government’s much-admired open data site, as the team is keen to stress.
“Useful mashups like this are testament not only to the quick thinking and hard work of the developers, but also to the city for making useful information available as open data,” says Google Product Manager Steve Crossan, the man behind Speak2Tweet, a service built in a weekend that allowed Egyptians to sidestep their country’s Internet ban during the 2011 revolution.
The idea that the city government and other easy-to-scapegoat entities may not be without credit has a discomforting flip-side: that the ordinary citizen may not be without blame. After all, according to Professor Cecilia Smoglie of the Buenos Aires Institute of Technology, the energy utilities are just one link in a chain that is unsound at all levels. State planning is short term. Suburbs grow while infrastructure stands still. Consumers waste energy. “This is everyone’s problem,” she says, “and the solution will depend both on government policies and individual responsibility.”
Mixed in with the bouquets were the inevitable brickbats. Topping the snarky FAQs: How the hell can you enter your power status on a website if you don’t have power?
The team loves that question -- an apparent gotcha that in fact helps strip bare one of the project’s core strengths. “Taking phones and tablets together, 33 per cent of our reports were generated by mobile users,” Roberto González says. “If you can receive and send cellular data, you can submit a report.”
Perhaps the project’s crowning moment occurred on December 29, during a meeting of the city government’s crisis committee. Its members were photographed in front of a screen displaying a color-coded map of the city. It was, as Linenberg confirmed in a tweet, the map generated by AcáNoHayLuz.
“That was a tremendous moment for us, to see our project being used by policy makers at that level,” he says.
None of the team seems remotely peeved to have received zero acknowledgement from said policy makers. Nor were they anything but delighted when their pageviews fell off a cliff just before New Year, as illustrated by the Matterhorn-shaped curve in the above chart.
“We just hope that we’ve planted some seeds out of which other collaborative projects might grow,” Acosta says. “If we’ve achieved just that... well, that’s really something.”
Chart: Alan Reid, Davo Galovotti, Pablo Paladino
This post was originally published on Smartplanet.com